F&B Market Intelligence for Hotels
Know what changed in your hotel’s F&B — before the next meeting.
Compset benchmarks your hotel and every outlet against the competitors that matter — then delivers the signals straight to WhatsApp, with detailed reports and an interactive dashboard.
48 participating hotels · Hotel & outlet-level insights · Delivered to decision-makers
Benchmarking trusted by teams across India’s leading hotel brands
Participating hotels and teams using Compset intelligence across our active markets.
Rooms have market intelligence. Hotel F&B deserves it too.
Most hotels track their own numbers. Few can see how they’re performing against the hotels competing for the same F&B demand.
Revenue grew — but did you gain share?
Internal year-on-year growth never tells you whether your competitors grew faster.
APC rose — but did covers fall?
Price gains can quietly mask weakening guest volumes.
One outlet is winning. Another may be losing.
Total F&B results hide what’s happening in banquets, bars, specialty and all-day dining.
See Pulse Direct in action
Your F&B benchmark — the moment it lands, on WhatsApp.
From market data to management action — directly on WhatsApp
Compset turns verified performance data into a connected intelligence journey for GMs, F&B leaders and outlet teams. The insight reaches your team where they already work.
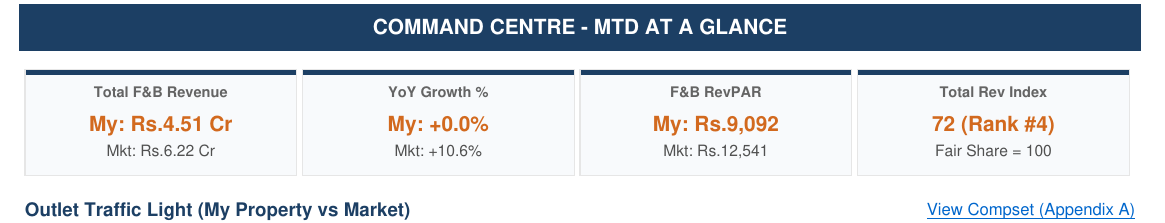
📊 Your Hotel — May F&B Pulse is ready.
Revenue ₹4.51 Cr (+0.0% YoY) · Market avg ₹6.22 Cr (+10.6%) · Index 72 · Rank #4.
Reply PULSE for the summary.
PULSE
Hotel snapshot: the market grew 10.6% while the hotel stayed flat. Specialty restaurants are capturing share; Banquets and All-Day Dining need attention.
Reply MENU for outlet deep-dives.
MENU
Your outlets:
1 · Banquets
2 · All-Day Dining
3 · Bar & Lounge
4 · In-Room Dining
Reply a number.
2
All-Day Dining — Deep Dive
Index 84 · covers gap −2,188 · APC ahead +₹119.
Priority: rebuild weekday footfall. Full Spotlight emailed.
1
Instant hotel snapshot
Revenue, market movement, fair-share index and rank — the moment the reporting cycle closes.
2
Management Pulse
Reply PULSE for the signals that matter: pace vs market, outlet winners and concerns, revenue-mix and outlook.
3
Outlet deep dives
Reply MENU, pick an outlet, and get a focused review of momentum, demand, rate, mix and immediate priorities.
4
Detailed reporting
The full F&B Pulse and Spotlight reports back every signal — for reviews, planning and budgeting.
No new app. No dashboard hunting. The insight reaches the team where they already work.
See the whole system — in two minutes
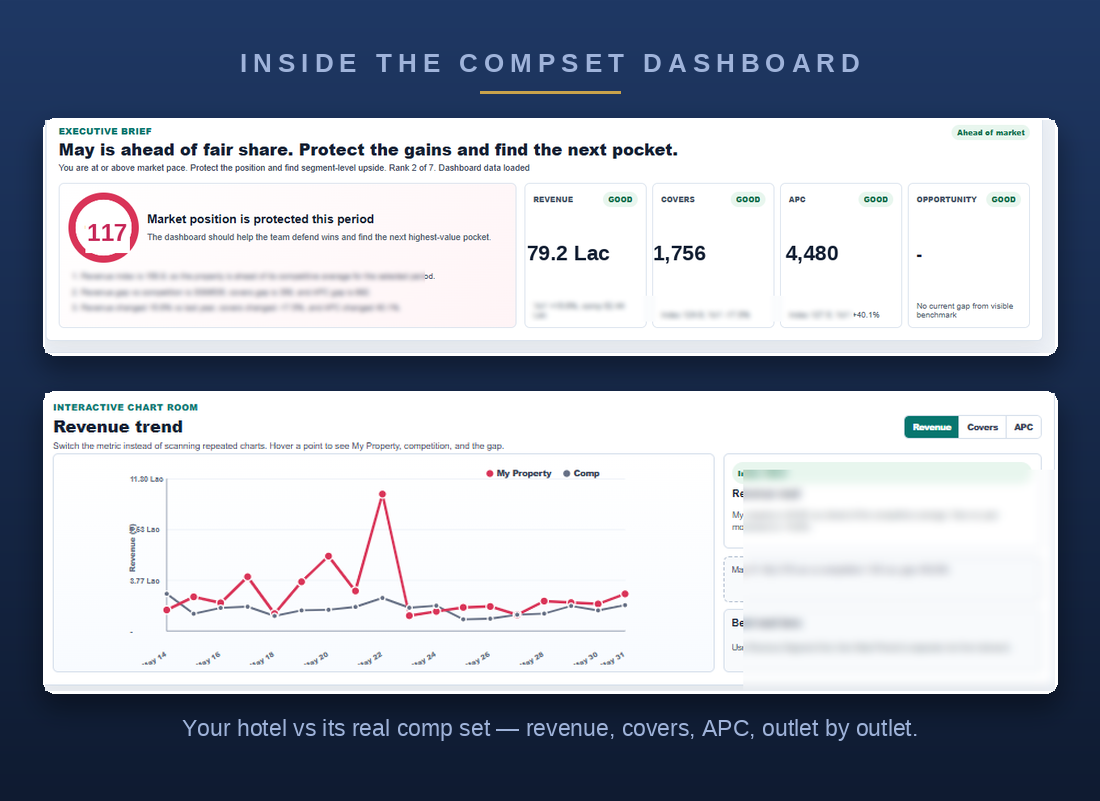
One benchmark, four ways to use it — Market Benchmark, Pulse Direct, Spotlight, and the Performance Room.
The full F&B Pulse report behind every WhatsApp summary
Four connected layers
Compset Benchmark
Verified competitive benchmarking — revenue, covers, APC, RevPAS, index and rank.
Compset Pulse
Hotel-level strategic signals delivered straight to management, on WhatsApp.
Compset Spotlight
Outlet-specific diagnostic reports on the real drivers behind performance.
Compset Dashboard
The analytical environment for ongoing exploration, comparison and tracking.
Market intelligence without changing your hotel systems
01
Select the right competitive set
Each outlet is matched to the hotels it actually competes with — not a generic city average.
02
Submit verified performance data
Revenue, covers and outlet-level performance, handled confidentially. Works with your existing data exports.
03
Receive actionable benchmarks
Dashboard access, Pulse updates and detailed benchmark reporting. No software to install.
Benchmarked outlet by outlet
Total F&B
Banquets
All-Day Dining
Bars & Lounges
Specialty Restaurants
In-Room Dining
Lobby Lounge & Cake Shop
Growth doesn’t always mean market-share growth
A luxury Bengaluru hotel (illustrative composite):
| Revenue growth |
+8.1% |
market +2.6% |
| Revenue index |
92 |
market 100 |
| Best-performing outlet |
index 117 |
|
| Priority outlet |
index 58 |
|
Growing far faster than the market — yet still below its competitive share. Compset pinpointed one outlet already winning and one needing immediate review, and the actions to close the gap.
Illustrative composite based on observed benchmarking patterns.
See what’s changing across the market
Bengaluru — FY 2025-26
Revenue grew on price, not people: APC rose 3.6% while covers fell 2.9%.
Mumbai — FY 2025-26
A strong +4.8% APC rise still couldn’t offset a 4.9% drop in covers — revenue slipped into the red.
Built for confidential hotel performance data
- Individual hotel data is never shown to competitors.
- Market results are aggregated and anonymised.
- Access is restricted to authorised users.
- Competitive sets are selected at outlet level.
Read our privacy & data approach →
Find out where your F&B is gaining — or losing — market share.
Get a confidential, outlet-level snapshot against your real competitive set.